Docker and Debugging does that sound unfamiliar. Ready Player One: Docker!
Debugging, breakpoints and pure bliss here is the VS Code Extensions that helped me speed up development.

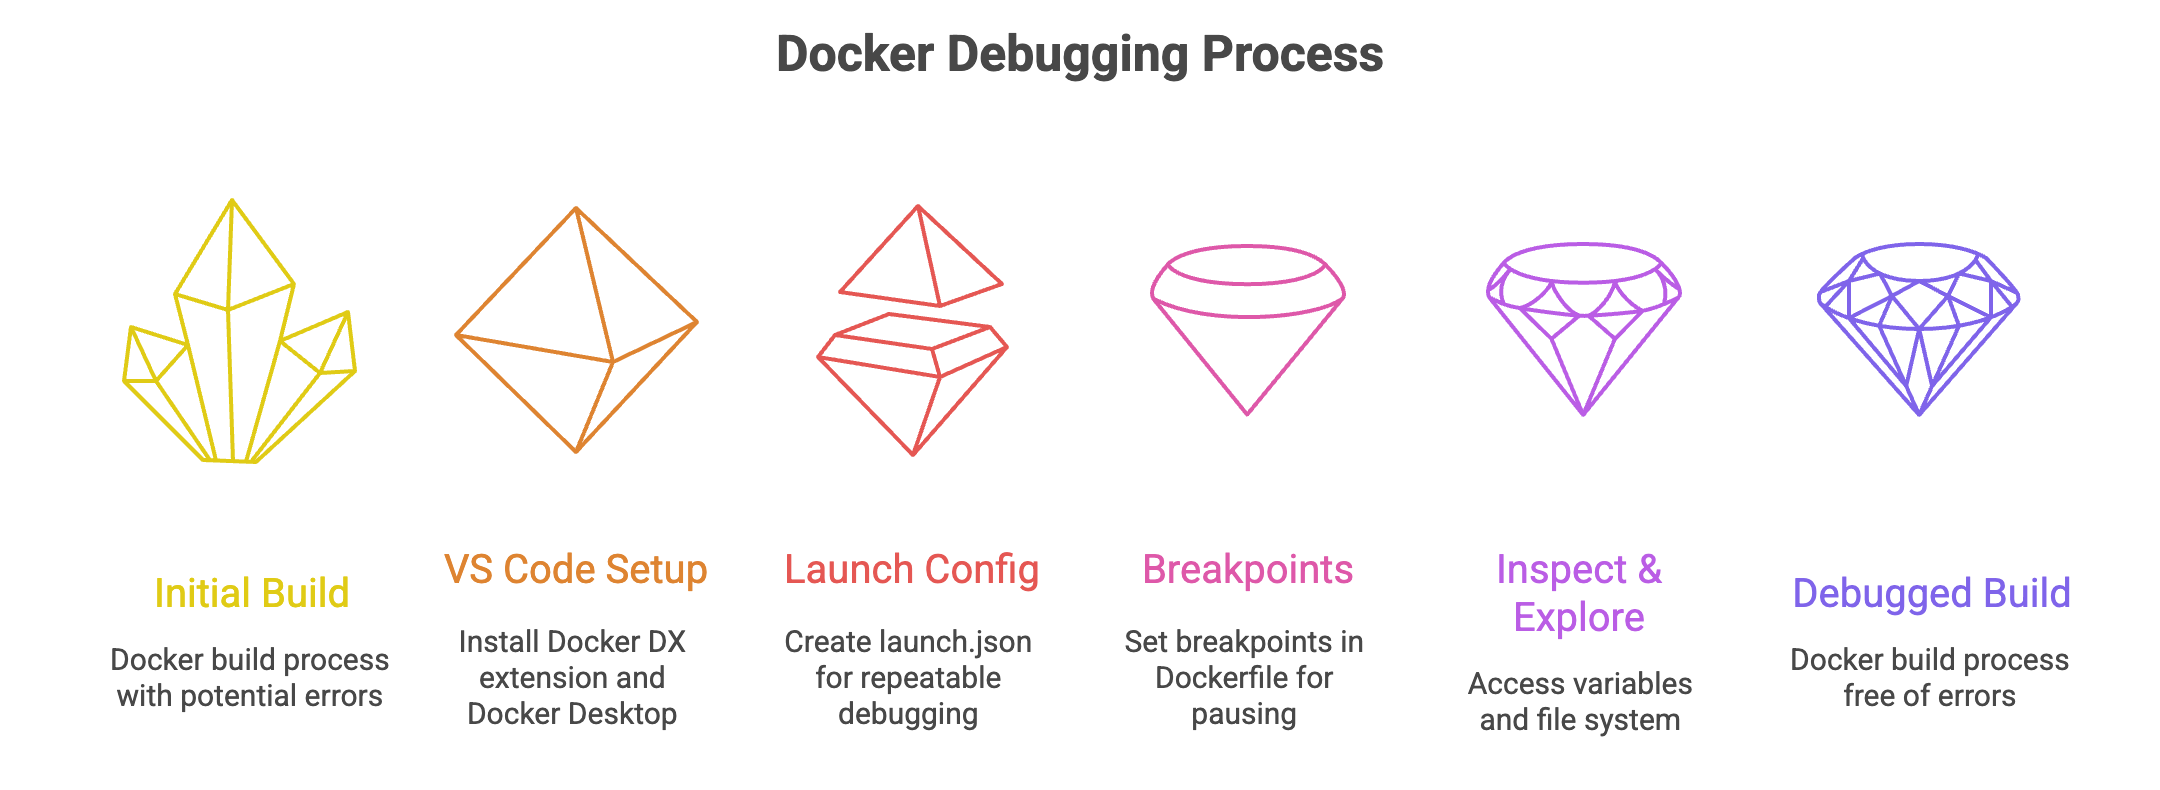
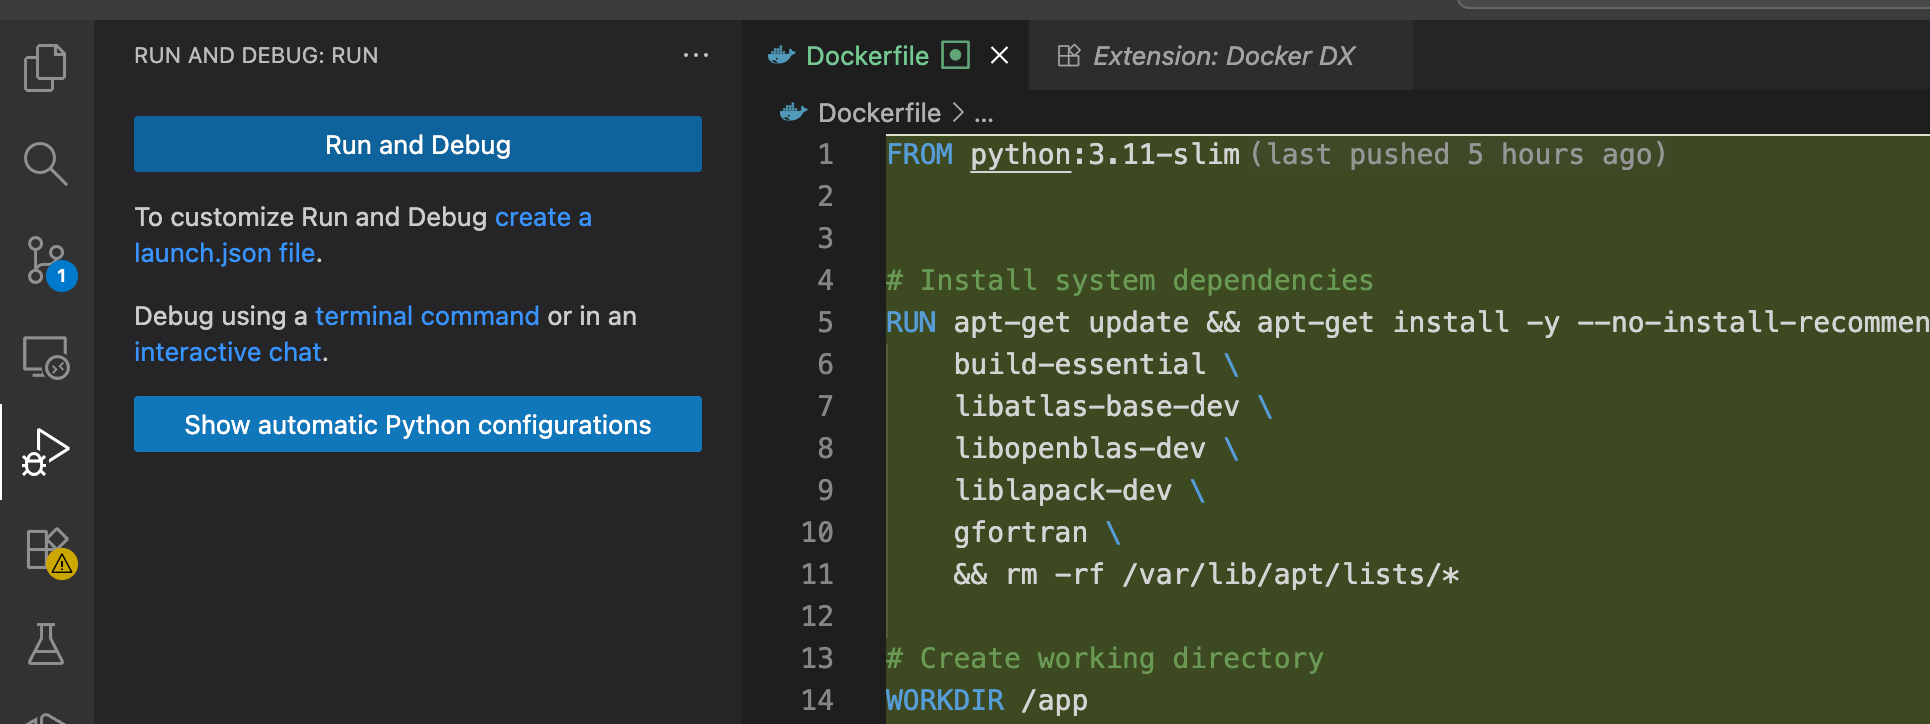
Level 1: Turbocharging Container Development, Debug DockerFile
Ever felt like your Docker build process is like a challenging game on “Hard mode” loaded with hidden traps? Lets break down the Docker debugging tips and how to use the VS Code extension to solve the mystery
Level 2: VS Code Extension ( Docker DX )
Before entering the arena, you need your loadout:
Docker DX Extension: Install the latest from the Marketplace
Docker Desktop latest
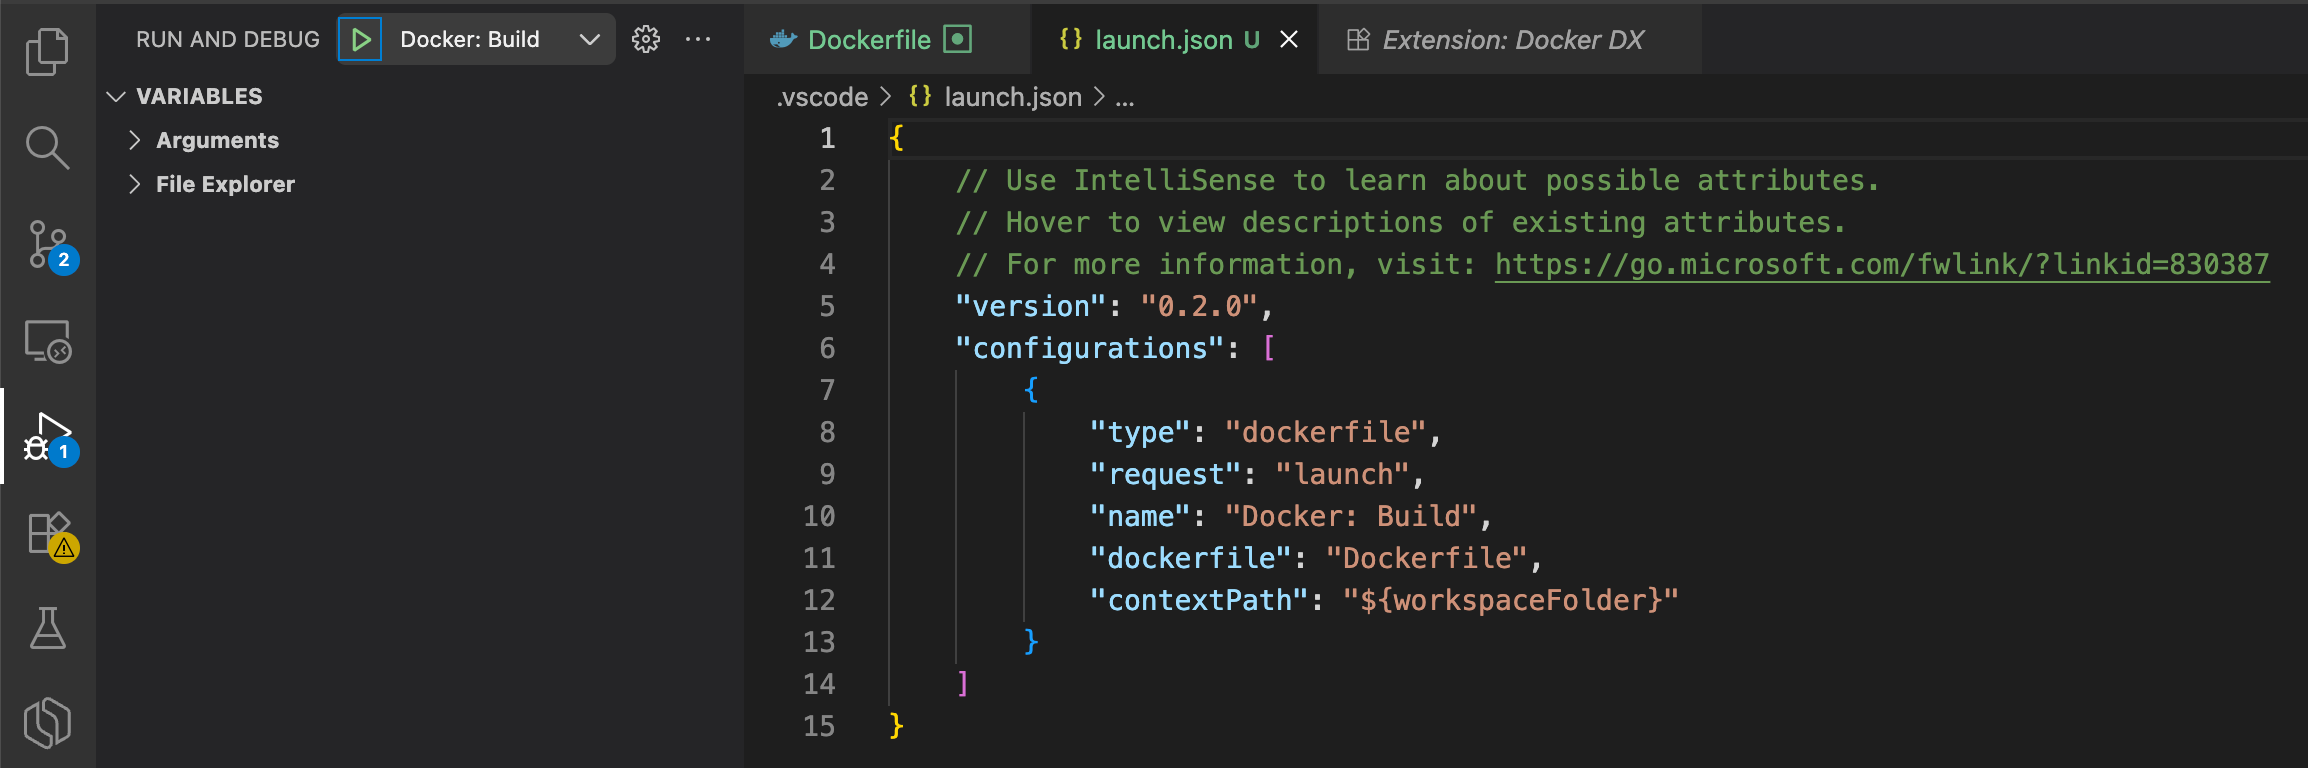
Level 3: Launch Configuration
Its like saving a game state or a saving a setup. Configure your launch configuration for repeateable, debuggable
Create a launch.json and add your configs
{
  “version”: “0.2.0”,
  “configurations”: [
    {
      “type”: “dockerfile”,
      “request”: “launch”,
      “name”: “Docker: Build”,
      “dockerfile”: “Dockerfile”,
      “contextPath”: “${workspaceFolder}”
    }
  ]
}
Level 4: Breakpoints
True debugging happens here, and you can set breakpoints in your RUN instructions. Pause, Inspect, iterate, and repeat. Debug Sessions become controlled experiments
Set breakpoints in Dockerfile by selecting any line and a Red Icon should appear
Start debugging by hitting F9 or clicking on the green RUN icon
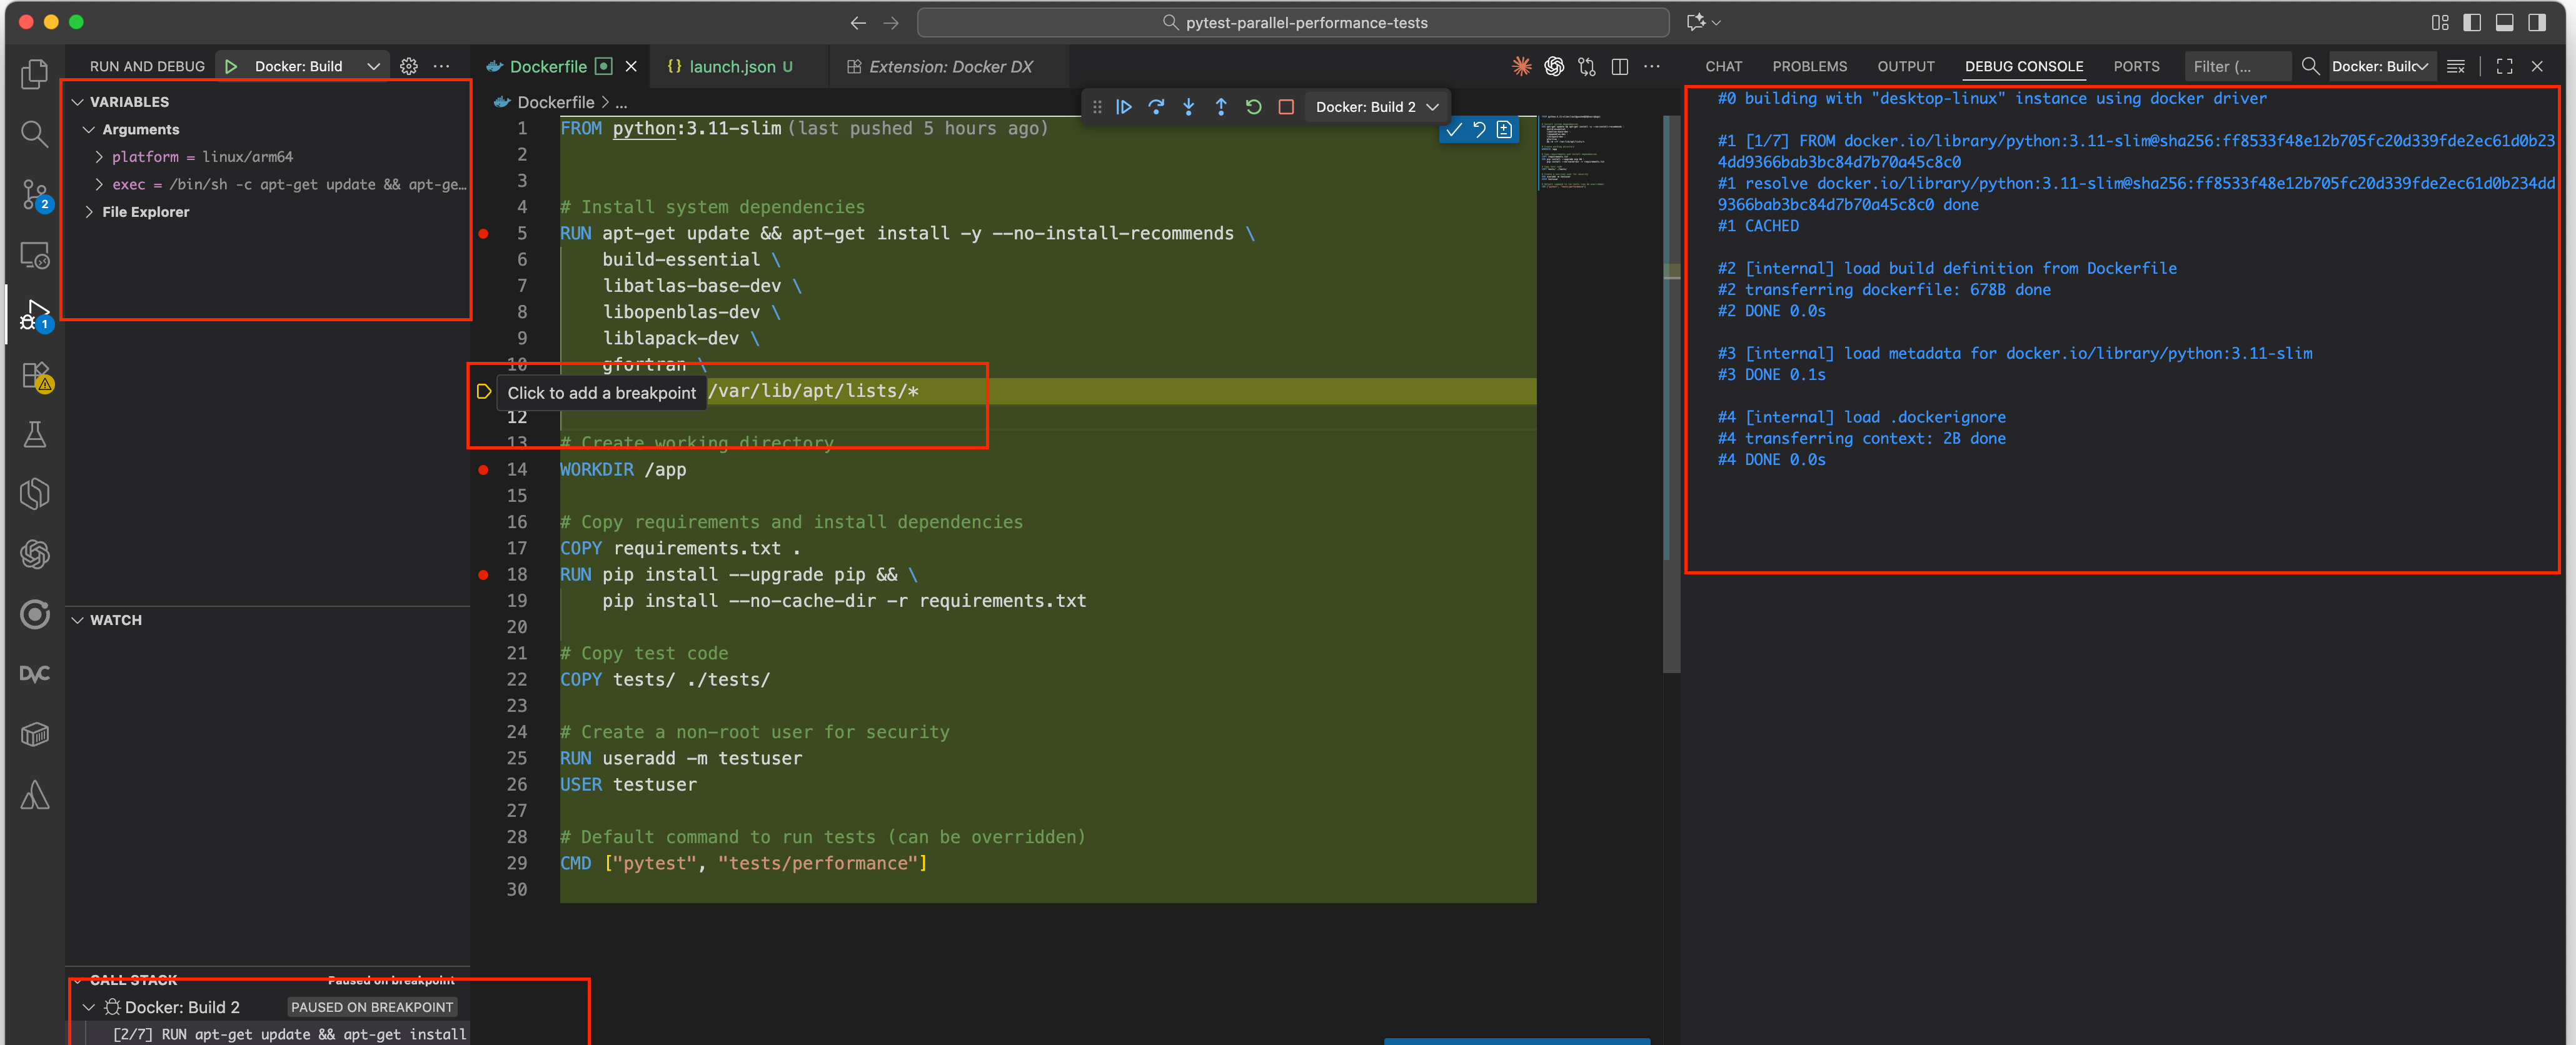
Level 5: Inspect , Explore , Exec
Variable Inspection:
Access ARGs, ENVs, and context right at the breakpoint. Like reviewing intermediate states in a long computation, never infer from final output alone.
File Explorer:
Directly view the filesystem in build context, see exactly what was copied in and what changed.
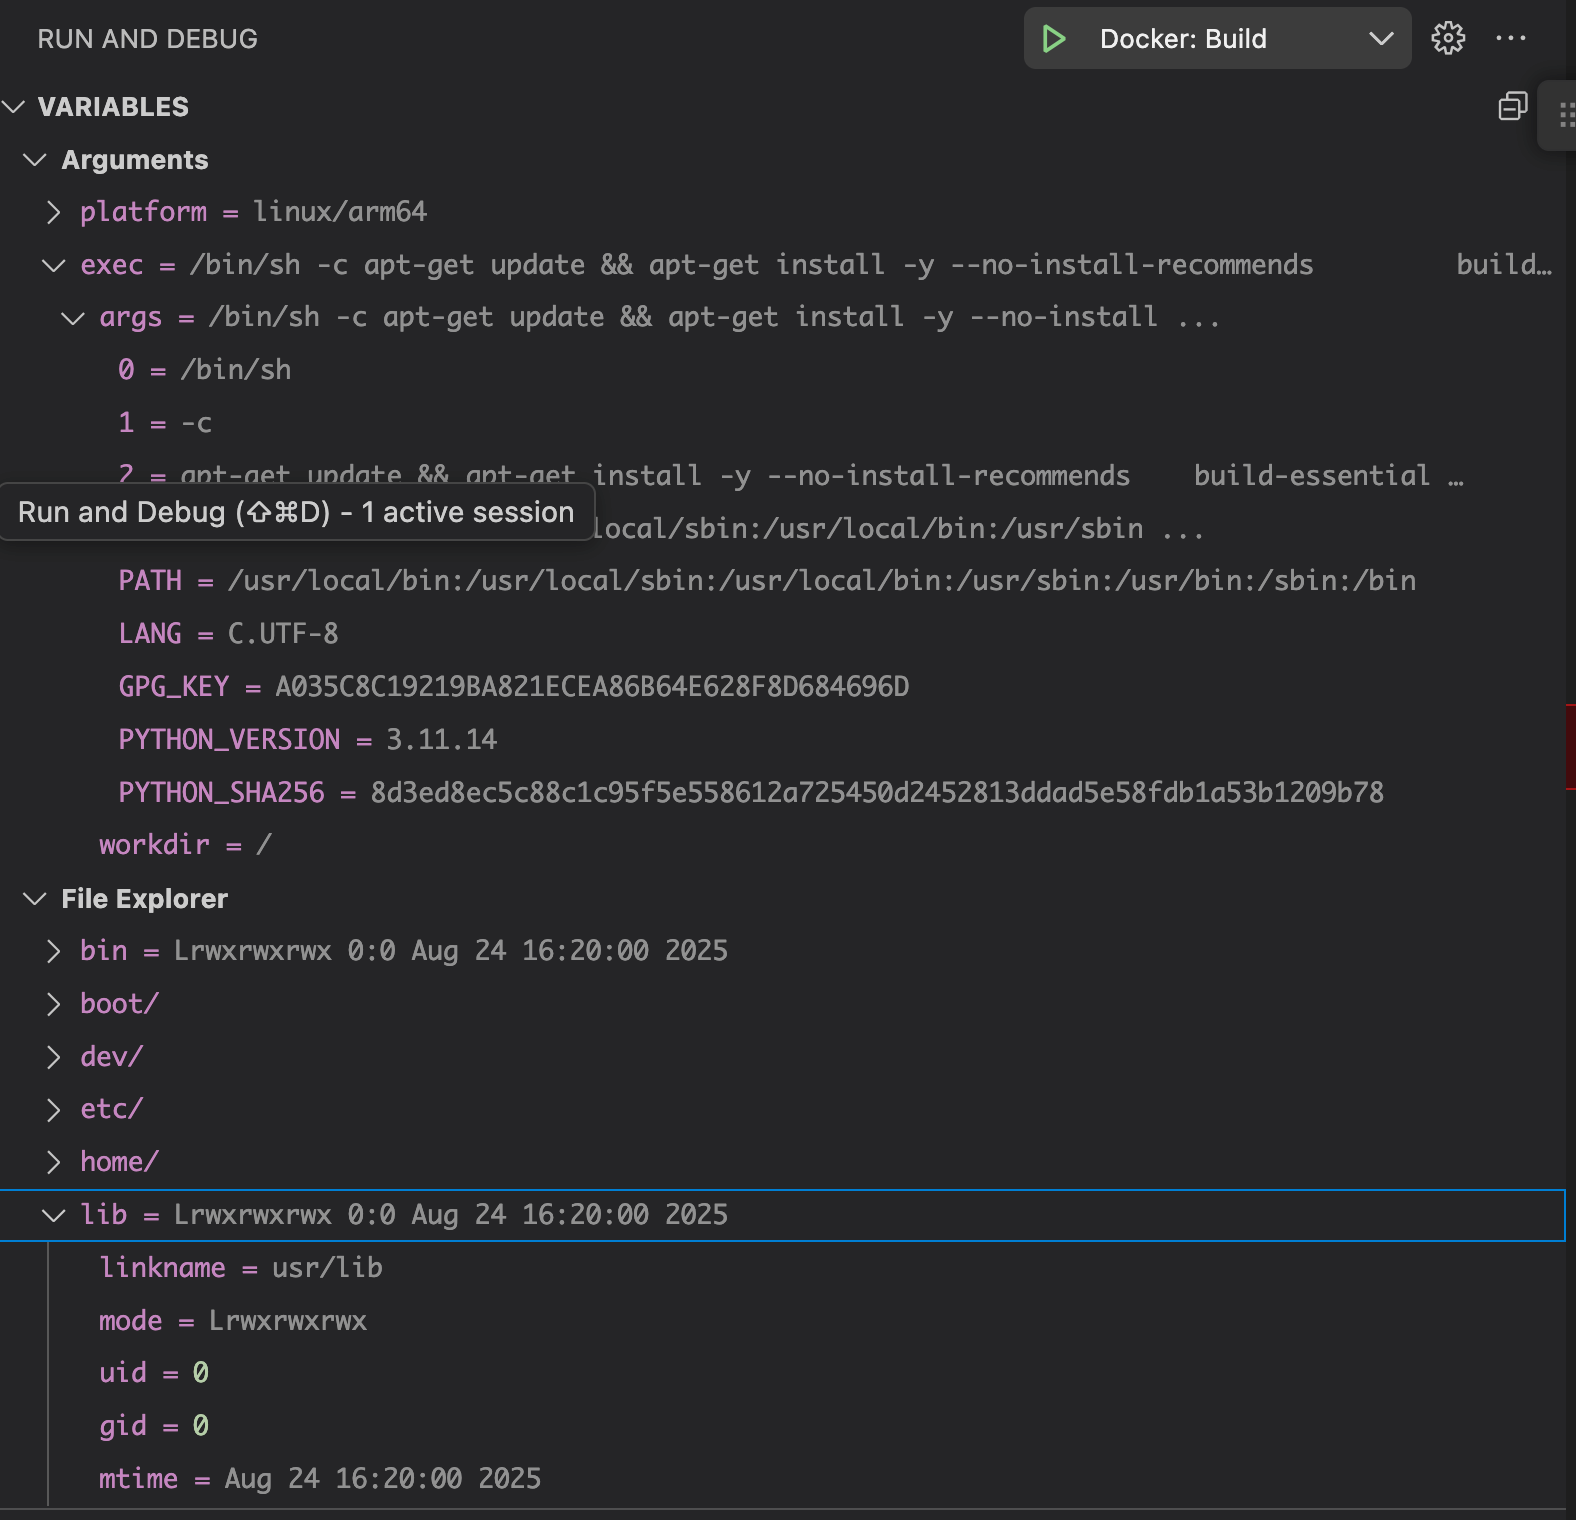
File Explorer Access :- Why It’s a Game Changer:
Full Filesystem Visibility:
Instantly browse the container’s current filesystem. Did your COPY command bring in the right files from context? Did the RUN operation or any build script generate expected outputs or logs?Content Peeking and Validation:
For text files, you can view their actual contents perfect for checking config files, environment dumps, or logs directly in the image.Change Tracking:
You get to see exactly what’s present after each step, helping you spot missing dependencies, orphan files, or misnamed directories early instead of hours later in production.